A useful question before a dashboard.
How do casual and member usage patterns differ, and how could an analytical model support a membership-conversion decision?
The project uses the Cyclistic bike-share case-study context to explore preparation, exploratory analysis, and a dimensional model. It is independent portfolio work, with no claimed client relationship or deployed commercial outcome.
Two source tracks, two different scopes. The Python repository supplies analysis code and chart artifacts. The BI repository supplies a demonstration export, formulas, a blueprint, and a browser prototype. Their dates and totals are not interchangeable.
Separate the evidence from the assumptions.
Separate data preparation, exploratory analysis, dimensional modeling, and scenario assumptions so each can be inspected on its own. The value is the inspectable implementation and the questions it makes possible, with its data boundaries kept visible.
Prepare & explore
Modular loading, cleaning, time-series exploration, spatial views, and clustering in the Python source.
Model the decision
Separate ride facts and dimensions, define measures, and organize the blueprint around a decision.
Expose uncertainty
Keep scenario inputs editable and distinguish demonstration outputs from historical findings.
A model with visible seams.
- Source preparation
- Python exploration
- Dimensional model
- Scenario explorer
A modular Python pipeline, analysis figures, a one-fact/six-dimension BI structure, DAX definitions, and a browser-based scenario model. The source includes Power Query definitions and DAX measures; the browser preview is a separate client implementation, not an embedded Power BI service.
The BI demonstration export contains 61,973 rows dated January–December 2025. Each row links ride measures and station keys to a dimensional model. This is separate from the run shown in the Python figures.
Inspect the fact-table export (opens in a new tab) and sample-data generator (opens in a new tab). The row count does not establish a validated historical customer-trip total.
What the artifacts can establish.
A seasonal pattern in the supplied figure
The daily-count artifact shows a winter trough and higher warm-season values. That is a visible pattern in this chart, not a verified network-wide demand estimate: its raw input and run manifest are not included here.
A model that can be inspected in parts
The repositories publish preparation code, model tables, DAX formulas, and a dashboard blueprint. They make the implementation approachable without requiring a fabricated production deployment story.
Scenario arithmetic is not customer evidence
The browser prototype assumes a pool of 11,480 and a $65 displacement allowance. Trip events do not identify unique customers, and multiplying them by a fee does not establish a conversion opportunity or revenue forecast.
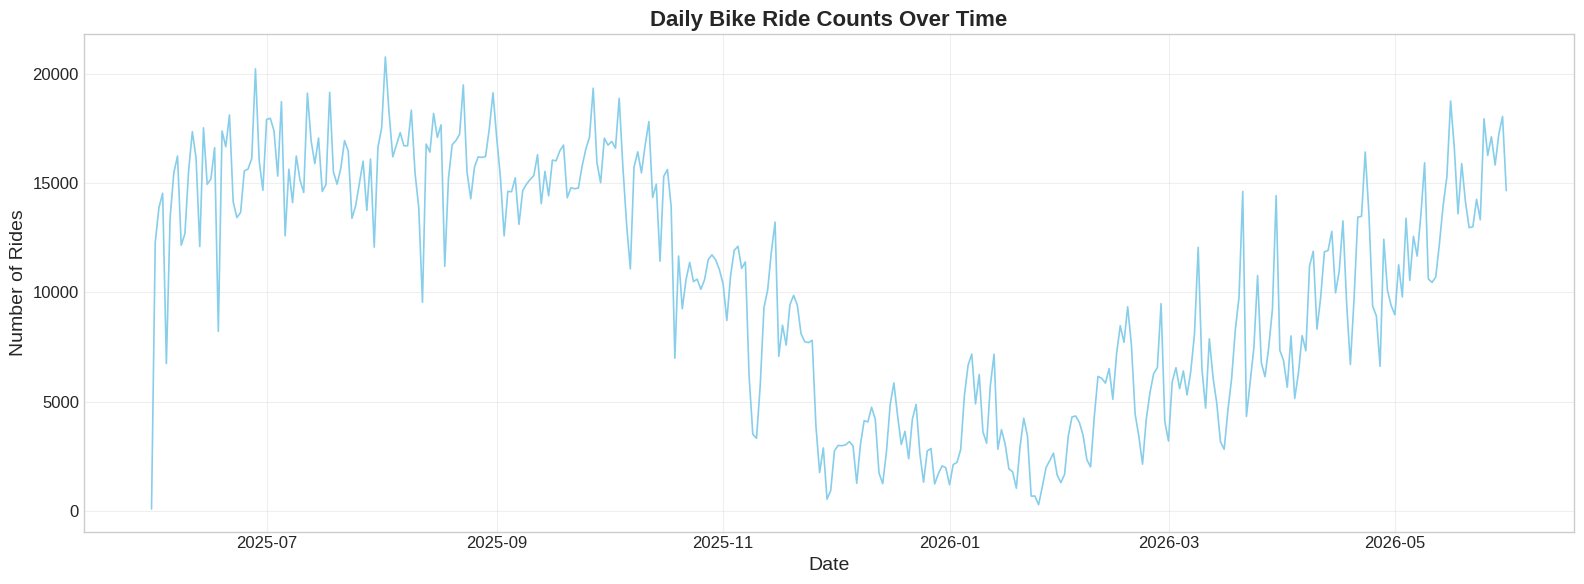
Python repository asset; date and ride-count axes preserved. The supplied chart spans part of 2025 into 2026. Its source run is distinct from the BI demonstration export, so no shared record count is inferred.
Open full-size figure (opens in a new tab)Explore a scenario. Inspect every assumption.
This explorer reproduces the published prototype’s arithmetic. Its pool of 11,480, $65 displaced-spend allowance, conversion rates, and prices are assumptions. The model does not establish a count of unique eligible customers.
Inspect the DAX definitions (opens in a new tab) or open the original browser demonstration (opens in a new tab).
Change the assumptions.
See the trade-offs.
Hypothetical conversion and pricing, using the Cyclistic model’s DAX calculation logic.
- Modeled conversions
- 804From an assumed pool of 11,480
- Projected gross ARR
- $95,676804 × $119 / yr
- Casual spend cannibalization
- −$52,260Assumed $65 lost spend per member
- Modeled net annual uplift
- +$43,416Gross ARR less displaced casual spend
Assumed pool × selected fee. This does not establish an addressable market or a forecast.
This illustration assumes a pool of 11,480, a selected conversion rate and annual fee, and $65 of displaced casual spend per modeled conversion. The pool is not a verified count of unique customers. Acquisition costs, retention, and operating costs are excluded. These values are hypothetical arithmetic, not a forecast or realized revenue.
The artifacts, at a readable scale.
These figures come from the Python repository. Captions follow the actual chart, rather than its sometimes mismatched filename. Select a figure, then open the original to inspect its axes, legend, and units.
Python repository asset; date and ride-count axes preserved. The supplied chart spans part of 2025 into 2026. Its source run is distinct from the BI demonstration export, so no shared record count is inferred.
Open full-size figure (opens in a new tab)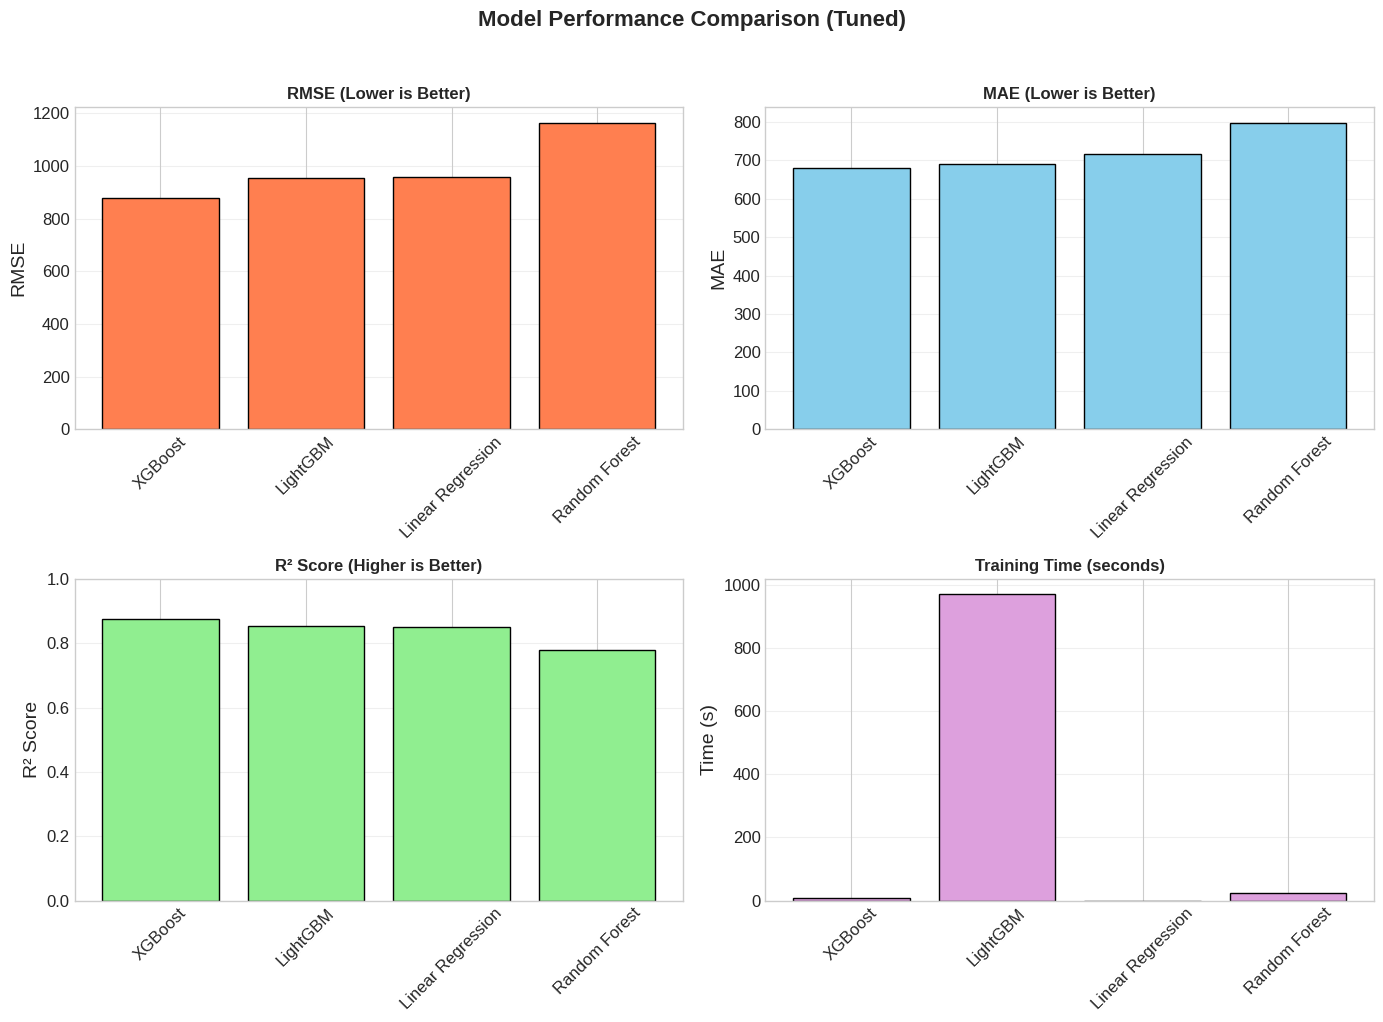
Lower error and higher R² indicate better fit within the source run; training time is in seconds. The figure reports several evaluation dimensions instead of one headline score. Without the original split and run record, it is not evidence of out-of-sample production accuracy.
Open full-size figure (opens in a new tab)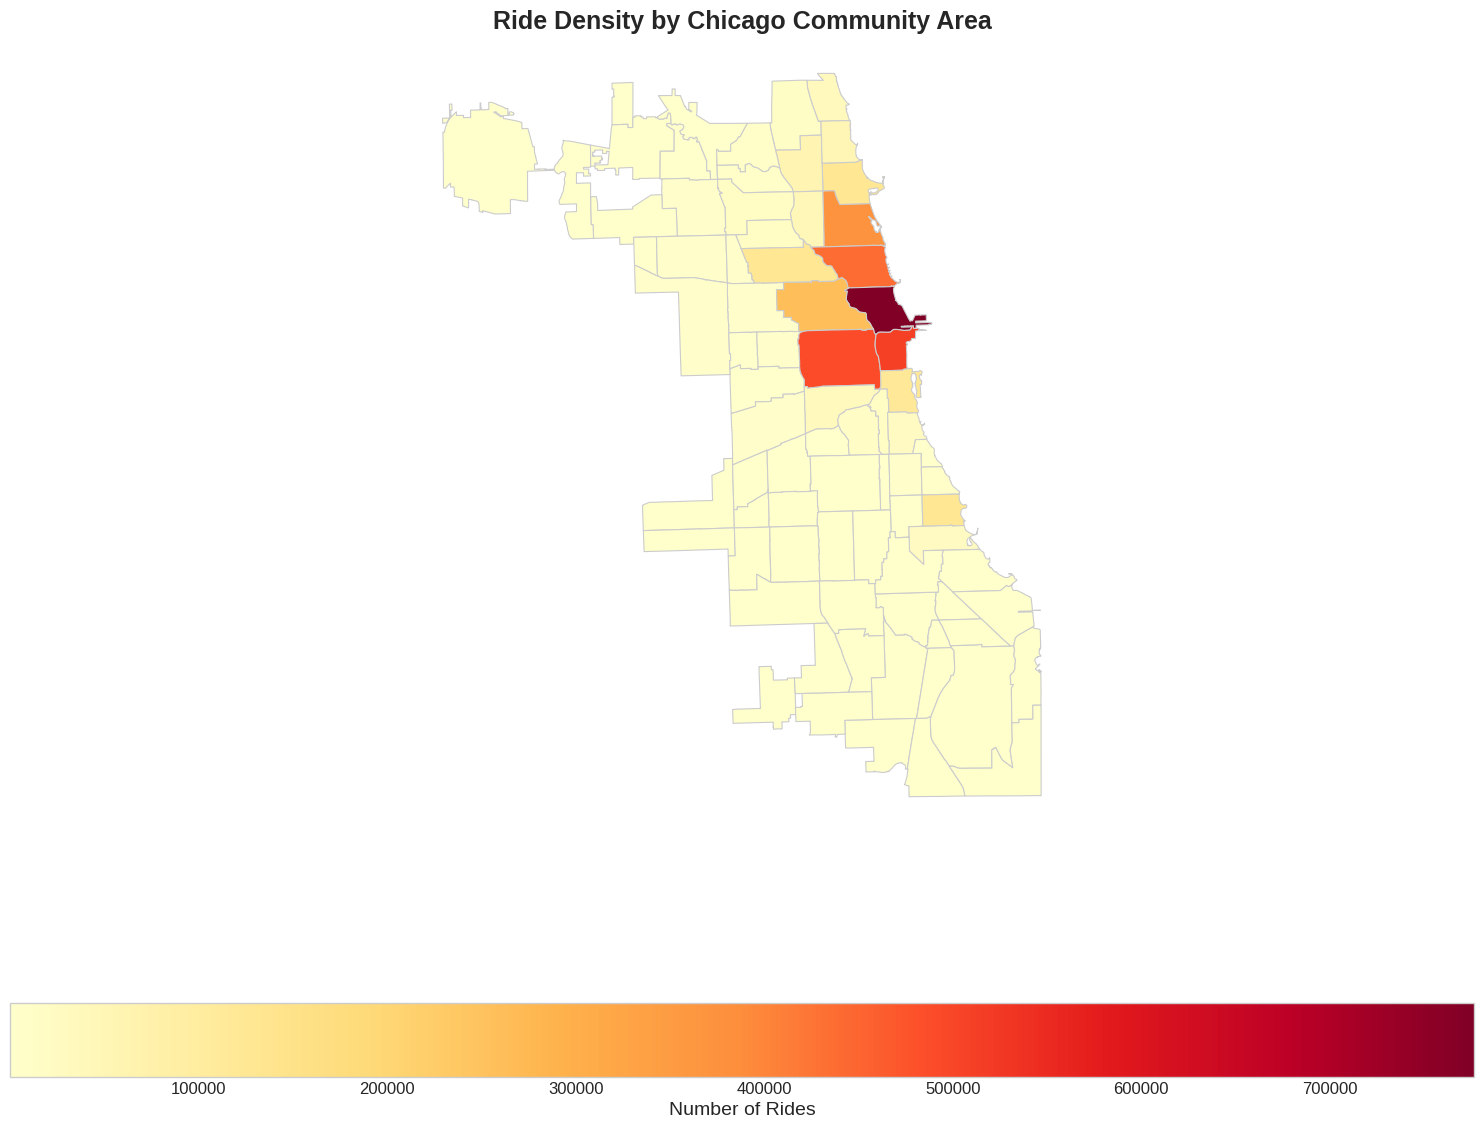
Geographic aggregation from the Python repository; not a live station feed. A spatial view of ride concentration. The map describes the supplied artifact and does not substantiate the previous claim that ten stations account for 54% of network volume.
Open full-size figure (opens in a new tab)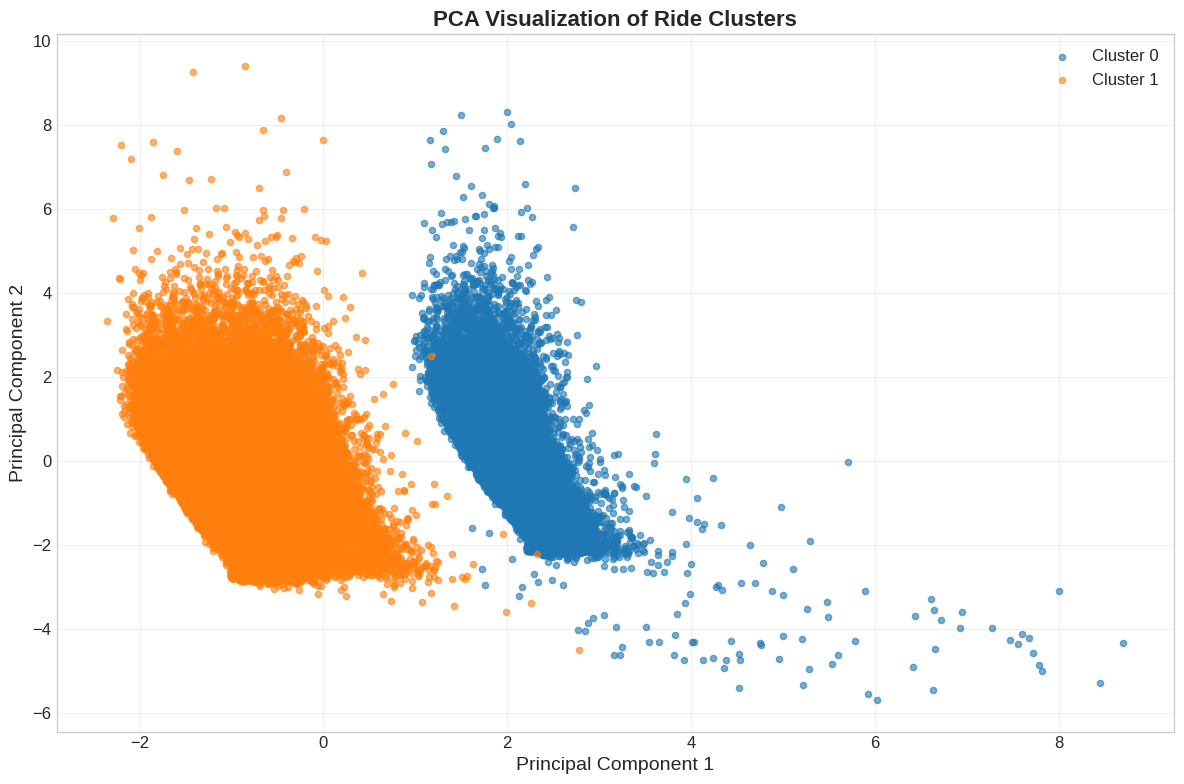
PCA projection; component values are transformed features, not geographic coordinates. The chart illustrates a feature-space separation. A cluster is not, by itself, a validated customer persona or a conversion audience.
Open full-size figure (opens in a new tab)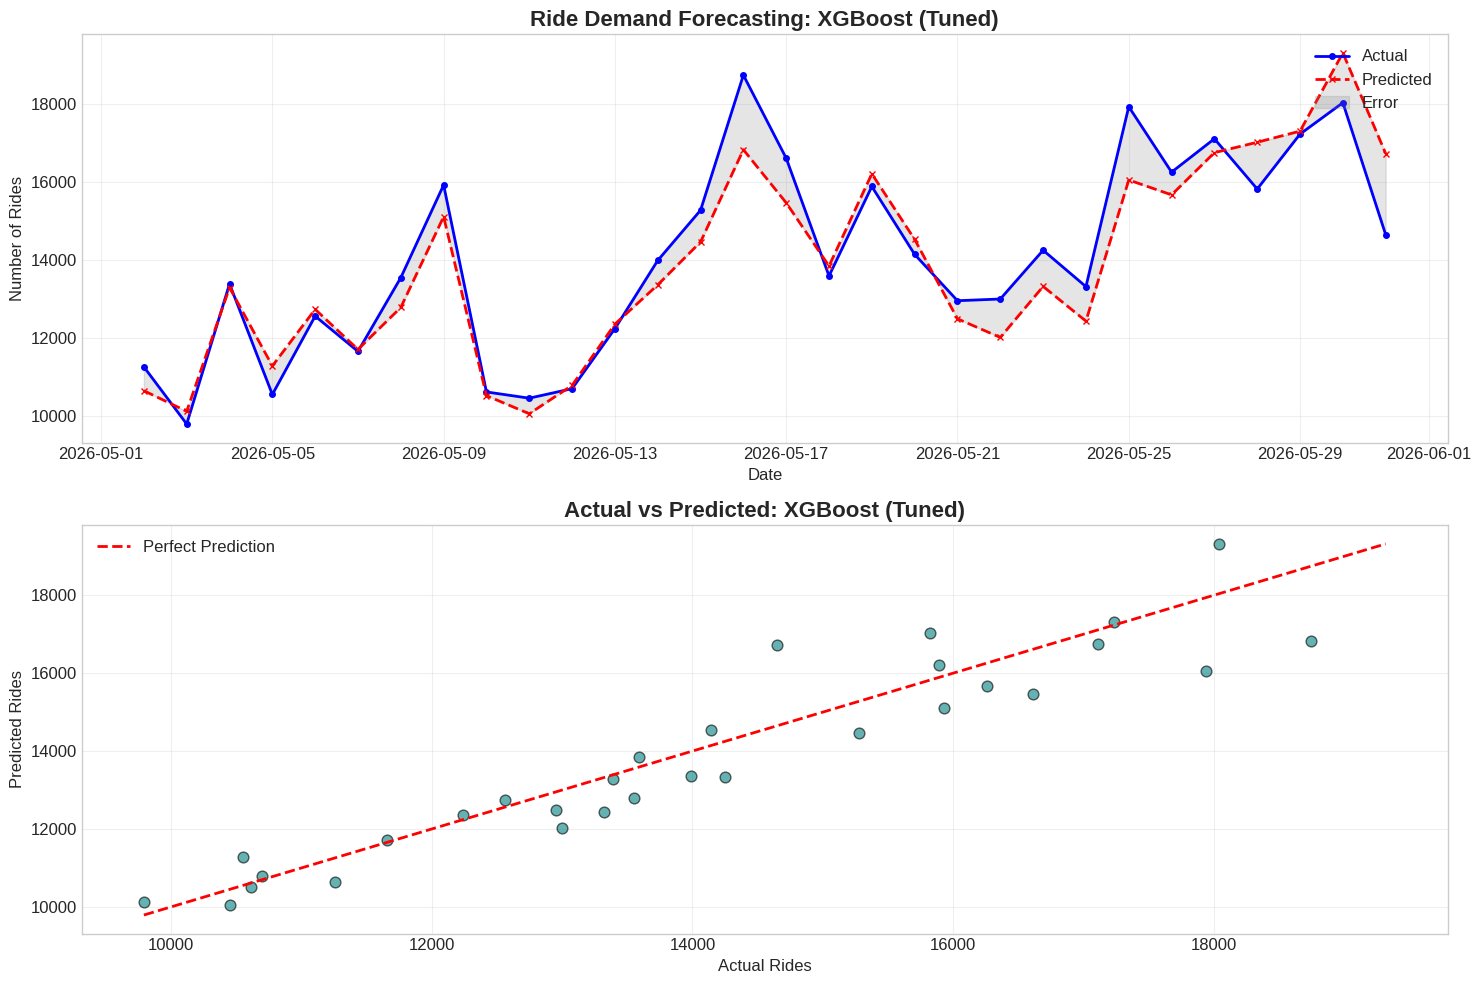
Published forecast artifact; no future-demand guarantee is inferred. Kept as a documented model-output example. The original evaluation split and prediction-interval calibration have not been independently reproduced.
Open full-size figure (opens in a new tab)Five original figures, with source limitations.
Original files & source boundaries
The figure names describe their contents. Their historical filenames are retained. These artifacts do not establish a verified source run or production accuracy.
The boundary is part of the work.
- Independent portfolio work; no client delivery, affiliation, revenue, or operational uplift is claimed.
- The BI source includes a random sample-data generator and an exporter that keeps mock data when no raw input is available. The checked export is therefore presented as demonstration data.
- The Python chart assets and BI export are separate artifacts. The chart dates extend into 2026; the checked BI export covers 2025. Their totals and findings must not be combined.
- The source run, raw historical data, train/test split, and reproducible evaluation record behind the chart artifacts are not established here. Model-comparison graphics are artifacts, not independently verified benchmark results.
- The simulator assumes a pool, conversion rate, annual fee, and displaced spend. It excludes acquisition costs, retention, rider deduplication, and operational costs. Its output is illustrative arithmetic, not a forecast.
The next investigation, before any rollout.
Validate the source before the strategy
Replace the demonstration export with a documented historical extract, retain the source period and cleaning log, and regenerate every published measure.
Test membership hypotheses with customer evidence
Deduplicate customers where consent and data access permit, then test a defined offer with acquisition, retention, and displacement costs measured explicitly.
Validate demand models on future periods
Use a time-based holdout, compare against a simple seasonal baseline, and keep a run record before proposing any operational use.